Viewing IL Generated by the C# Compiler With ILSpy
ILSpy makes it easy to view decompiled IL that was generated by the C# compiler. This post will walk you through the few short steps needed to see your IL code.
GitHub - icsharpcode/ILSpy: .NET Decompiler with support for PDB generation, ReadyToRun, Metadata (&more) - cross-platform!
.NET Decompiler with support for PDB generation, ReadyToRun, Metadata (&more) - cross-platform! - GitHub - icsharpcode/ILSpy: .NET Decompiler with support for PDB generation, ReadyToRun, Metada...
 icsharpcode
The Short Version
- Grab the Visual Studio Extension (.vsix) via https://github.com/icsharpcode/ILSpy/releases
- Install the .vsix to your Visual Studio flavour of choice by double clicking on it
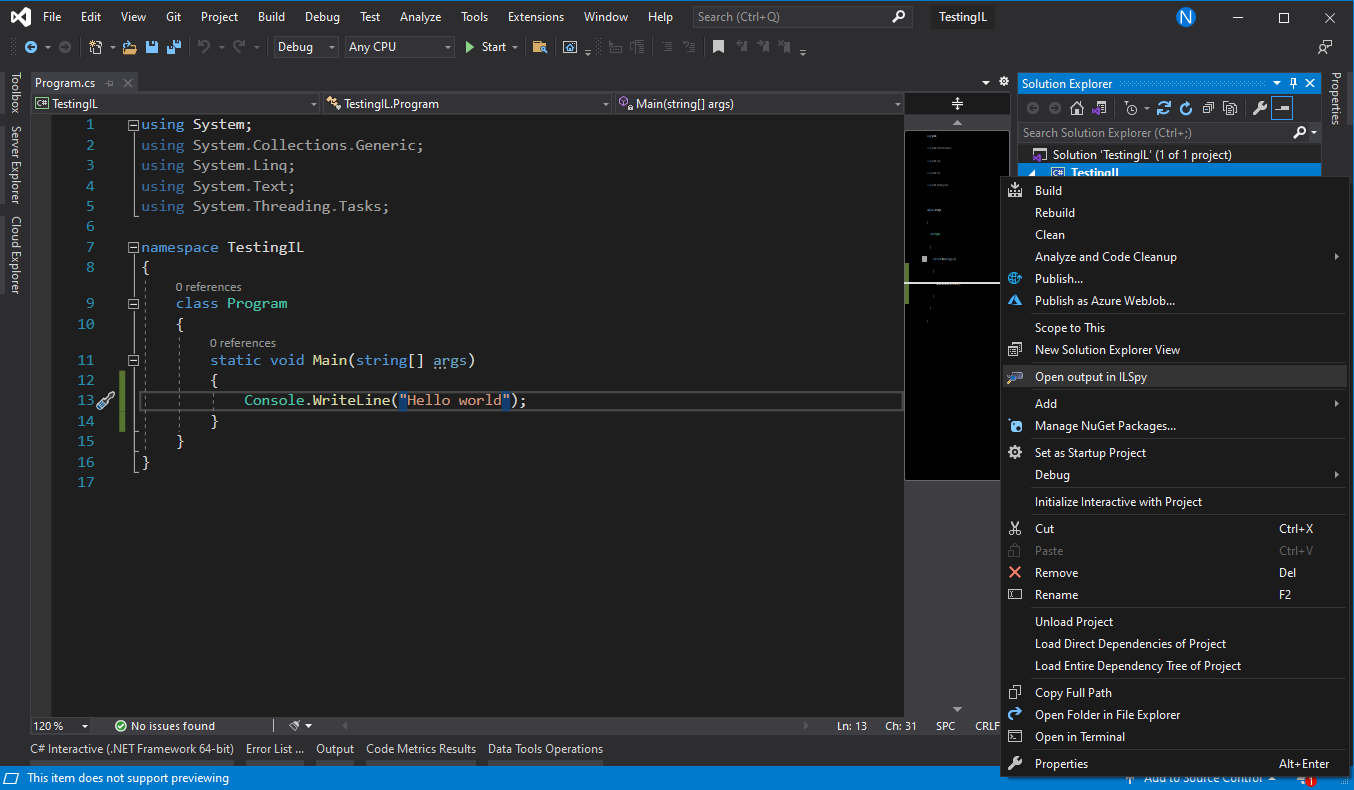
- Open your project/solution in Visual Studio (and make sure you build)
- In the Solution Explorer, right click the project and click on "Open output in ILSpy"
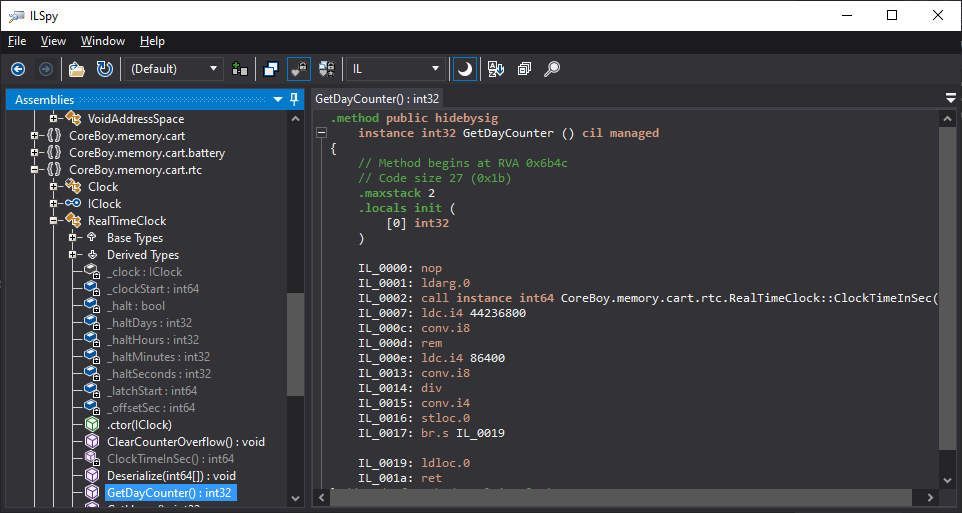
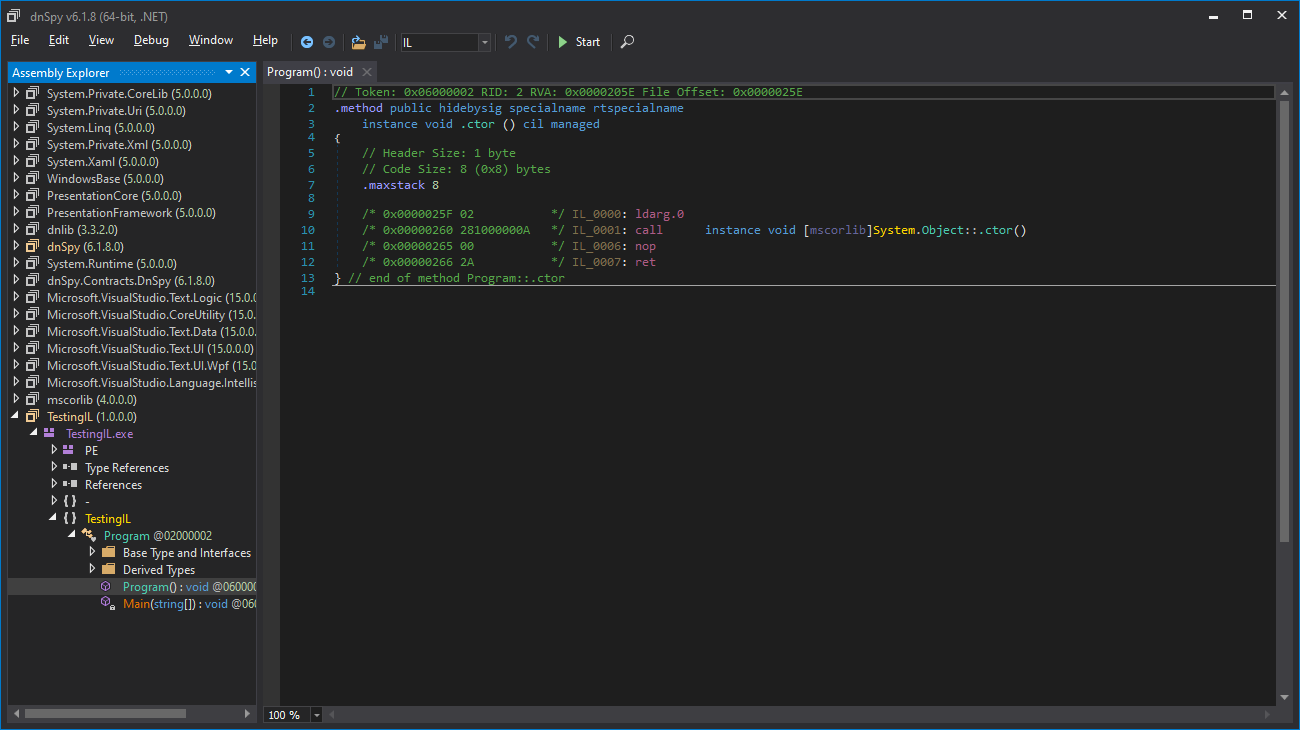
- This opens the ILSpy window. Navigate to your code via the Assembly Explorer on the left. For this example we'll navigate just to the Main() method.
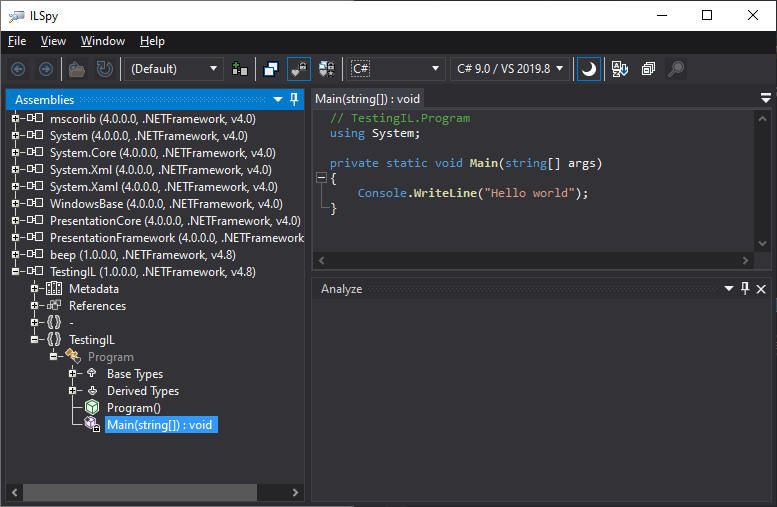
- Use the "Select language to decomplile to" dropdown and click "IL"
Some Extra Points
dnSpy
ILSpy uses dnSpy under the hood according to the dnSpy Github repo so if you've used dnSpy before, it will be pretty much the same:
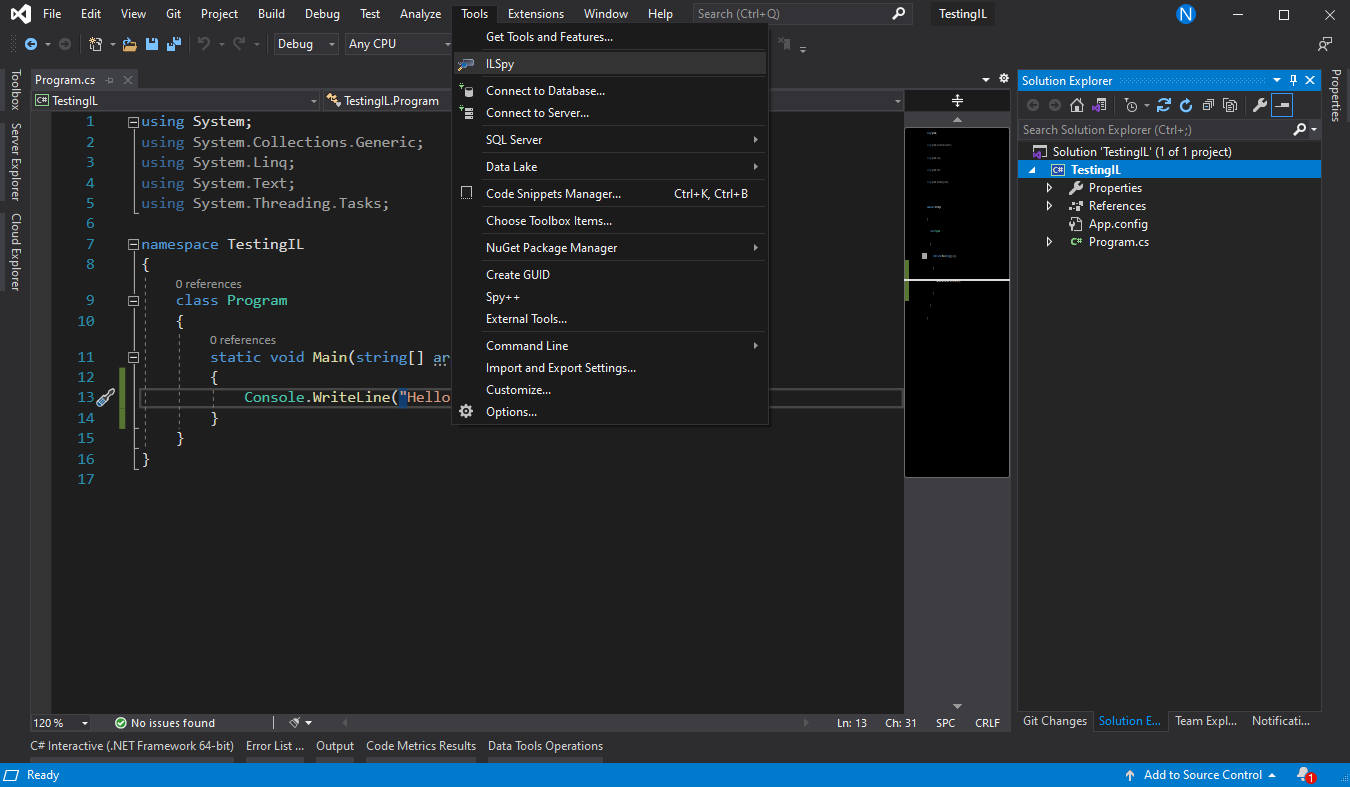
Launching ILSpy Without Context
The nice part of having ILSpy integrated into Visual Studio is you can open it with the context of your project as seen at the top of this post. But you can also have ILSpy open fresh by going to Tools > ILSpy. Opening this way will also bring an existing window to the forefront.
To Conclude
ILSpy can do a lot more, check out the Github page linked above for more, but in terms of just viewing the IL for your code, it's as easy as the few steps above. Happy hacking!